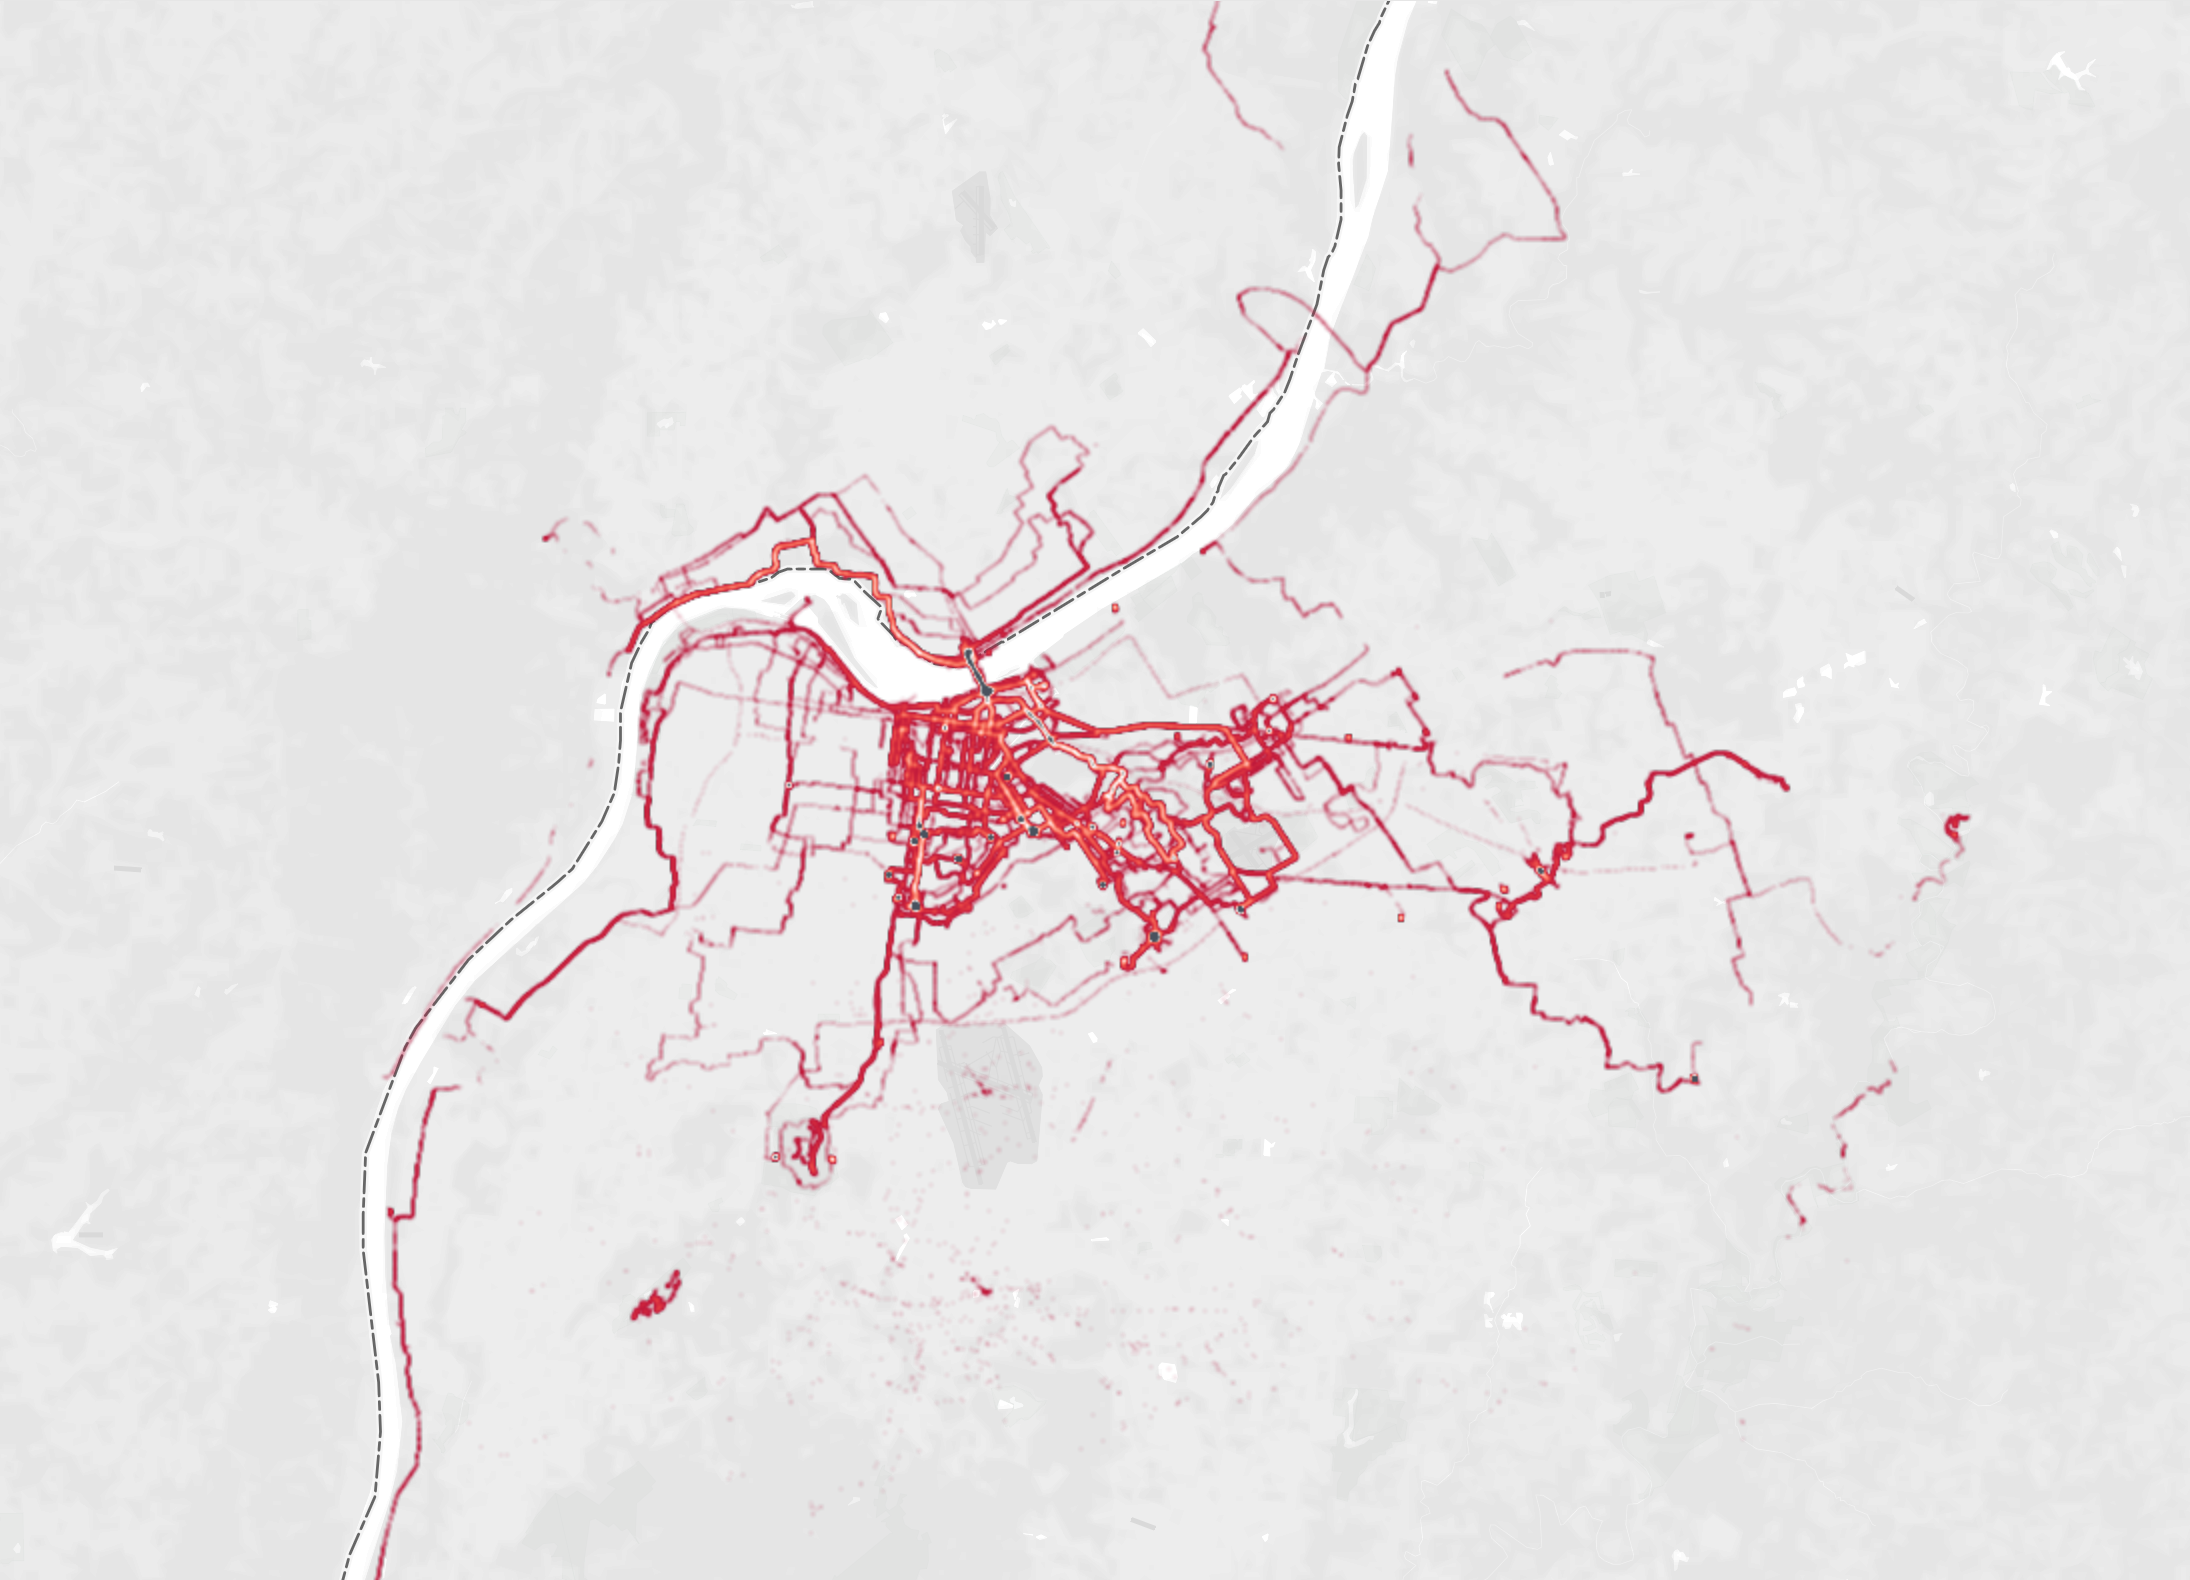
Below is a heat map of all the routes from all our wonderful volunteers from July 2019 to July2020!
The intensity goes from red to white to black, black being the most frequented routes.
The colors in this map do NOT relate to temperature data in this map, just location. See the additional maps below to see air quality (VOCs) and temperature data from the project.
The map below is a representation of the Volatile Organic Compounds sensed by our volunteer cyclists. Good air quality has less VOCs and is represented as green to yellow. Bad air quality, or high counts of VOCs, are represented in red to black. You can change the month represented from the project on the right. Hover your mouse over any part of a cyclist’s path to see the data readings, timestamp, and more.
Volatile Organic Compounds are particulates in the air that you can’t see but you can often smell. They can come from chemicals released in the air from man made exhaust, fires, and leaks. Find out more about VOCs from the Environmental Protection Agency.

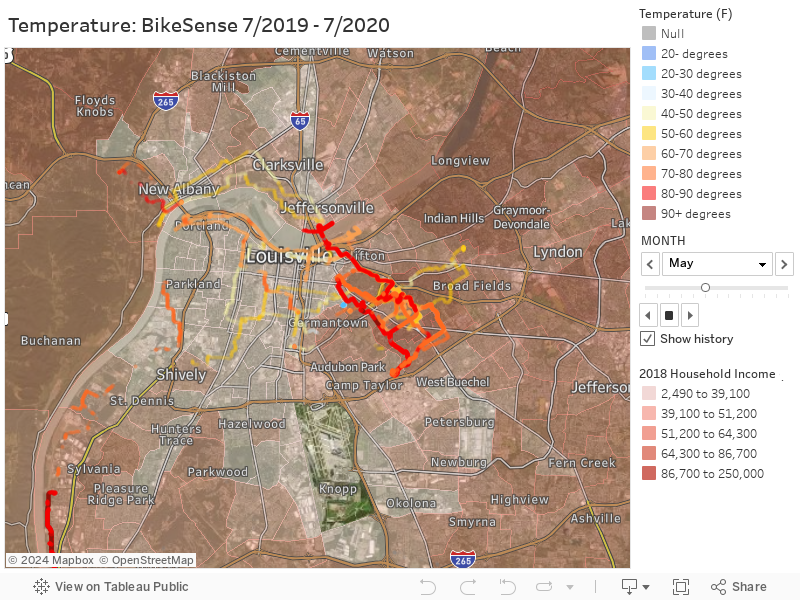
The map below is a representation of the temperatures sensed by our volunteer cyclists. Change the month on the right to see the different temperatures. Hover your mouse over the cyclist’s path to see the data and timestamp. Uncheck Show history to see only data from one month at a time.
It is overlaid on a map of Louisville color-coded by household income. Louisville has a heat-island effect, meaning the temperatures in the city are higher than the surrounding rural areas. This is due to the high amount of hard surfaces like blacktop and concrete that retain heat from the sun. For its size, Louisville also has a low tree canopy relative to mid-western cities of similar size. This means that there is only ~13% of the area of the city that is under tree shade. That lack of shade makes the heat island worse. Often the amount of tree cover relates to income levels. Neighborhoods with more trees often house families with higher overall income, and visa versa.
Find out more about Louisville’s tree health and its impact on us at UofL Envirome Institute’s Green Heart study!
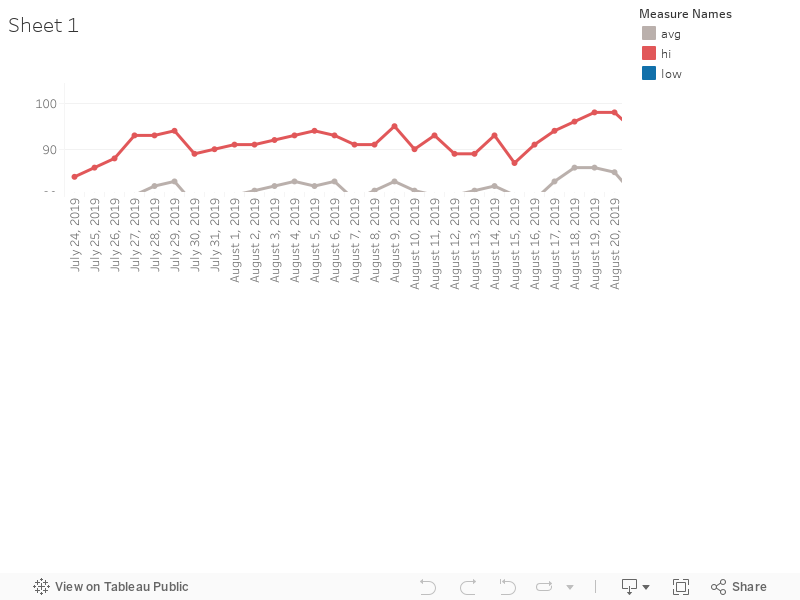
Government Temperature Data for Louisville, KY from July 2019 - July 2020